How to Analyze an ETF Before You Invest
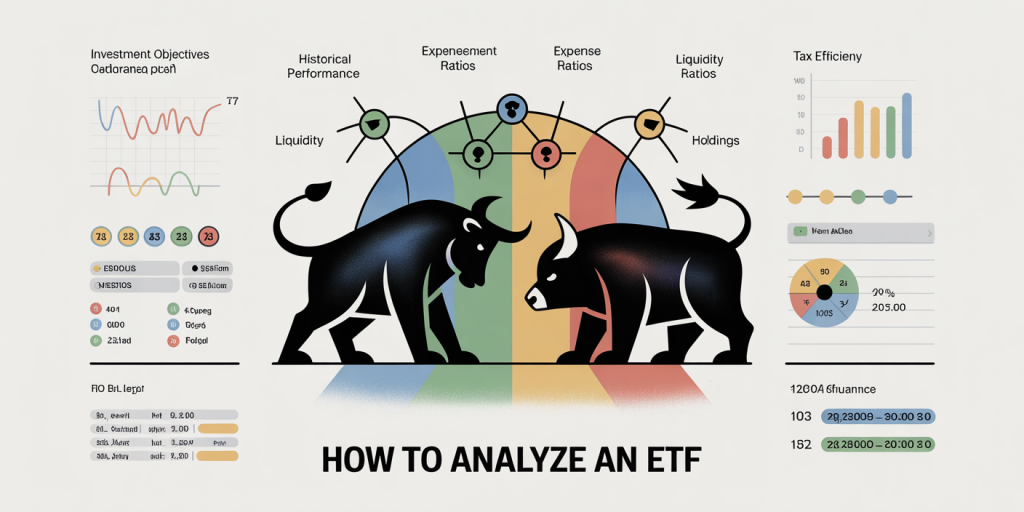
Exchange-Traded Funds (ETFs) have become a staple in modern investment portfolios due to their flexibility, diversification, and cost-effectiveness. Yet, with thousands of ETFs available, investors must employ a detailed and strategic analysis before committing capital. Understanding how to thoroughly assess an ETF can help mitigate risks, enhance returns, and align investments with personal financial goals. This article explores essential criteria and practical steps an investor should take when analyzing ETFs, supported by relevant data and real-world cases.
Understanding the ETF’s Investment Objective and Strategy
Before buying any ETF, it is crucial to comprehend its investment objective and strategy. ETFs come in various shapes and sizes, from broad market index funds to niche sector or thematic funds, and each serves a distinct purpose.
For example, the SPDR S&P 500 ETF Trust (SPY) aims to track the S&P 500 Index, offering investors exposure to large U.S. companies. Meanwhile, the Global X Robotics & Artificial Intelligence ETF (BOTZ) focuses exclusively on companies in robotics and AI technology sectors, targeting growth rather than broad market exposure. This difference affects an ETF’s risk profile, volatility, and long-term returns.
Reviewing the ETF’s prospectus or factsheet can provide insight into its holdings, sector allocation, and geographic exposure. An ETF tracking emerging markets, such as iShares MSCI Emerging Markets ETF (EEM), might offer high growth potential but also comes with higher geopolitical and currency risks. Conversely, a bond index ETF like iShares Core U.S. Aggregate Bond ETF (AGG) has lower volatility but may deliver more moderate returns.
A clear understanding of the ETF’s strategy helps investors determine whether the fund aligns with their risk tolerance and investment horizon. For example, growth-oriented ETFs may perform well in bull markets but underperform during downturns, while income-focused ETFs can provide stability in turbulent times.
Evaluating the ETF’s Performance and Volatility
Historical performance is not always indicative of future returns, but analyzing past data is a critical step in ETF evaluation. Investors should look beyond headline returns and assess consistency, risk-adjusted performance, and drawdowns.
For instance, consider the 5-year annualized returns and standard deviation of two popular ETFs: SPY and Vanguard Total Stock Market ETF (VTI).
| ETF Symbol | 5-Year Annualized Return | 5-Year Standard Deviation |
|---|---|---|
| SPY | 11.3% | 15.0% |
| VTI | 11.1% | 14.8% |
Both ETFs exhibit similar returns and volatility, but nuances exist. VTI offers a broader U.S. market exposure, including small and mid-cap stocks, whereas SPY is limited to large-cap firms. This subtle difference can affect performance during certain market cycles.
Moreover, assessing downside risk is essential. Using metrics like Maximum Drawdown—the largest peak-to-trough decline—helps gauge how an ETF reacts during market downturns. For example, during the COVID-19 market crash in March 2020, ETFs with higher exposure to cyclical sectors experienced sharper declines compared to more diversified funds.
Additional metrics such as the Sharpe Ratio or Sortino Ratio provide insights into risk-adjusted returns, indicating if investors are compensated adequately for the volatility they endure. A Sharpe ratio above 1 is generally considered favorable, reflecting efficient risk management.
Analyzing Expense Ratios and Trading Costs
Costs directly impact net returns, making expense ratios and trading fees crucial factors in ETF analysis. Lower expenses allow investors to keep more of their gains.
The average expense ratio for U.S. equity ETFs hovers around 0.20%, but this varies widely based on the fund’s strategy and complexity. For example:
| ETF Symbol | Expense Ratio | Fund Type |
|---|---|---|
| SPY | 0.09% | Large-cap U.S. equities |
| ARKK | 0.75% | Actively managed tech |
| AGG | 0.04% | Bonds |
Passive ETFs traditionally charge less than actively managed ones due to lower operational costs. However, some thematic or niche ETFs, like ARK Innovation ETF (ARKK), command higher fees in return for potentially higher growth and specialized exposure.
Apart from expense ratios, attention should be given to bid-ask spreads and commission costs. ETFs with low trading volume or complex assets may have wider spreads, increasing trading costs. For example, ultra-niche ETFs like the VanEck Rare Earth/Strategic Metals ETF (REMX) often have higher spreads compared to large ETFs such as SPY or VTI.

A practical example: If an investor purchases $10,000 of an ETF with a 0.10% expense ratio versus one with a 0.75% expense ratio, the difference amounts to $65 annually, assuming no compounding. Over 20 years, this cost disparity can significantly erode total portfolio value.
Scrutinizing Liquidity and Asset Size
Liquidity is an often-overlooked dimension vital to ETF investing. It encompasses both the ETF’s assets under management (AUM) and trading volume, which affect the ease of buying/selling ETF shares and the stability of market prices.
Larger ETFs with high average daily volume tend to have tighter bid-ask spreads and lower trading costs. For example, SPY boasts over $370 billion in AUM and a daily trading volume often exceeding 80 million shares, making it one of the most liquid ETFs globally. On the other hand, smaller ETFs such as Global X Cannabis ETF (POTX) with less than $50 million in AUM may pose liquidity challenges.
Here is a comparative table highlighting liquidity factors:
| ETF Symbol | Assets Under Management (AUM) | Average Daily Volume (Shares) | Bid-Ask Spread (bps) |
|---|---|---|---|
| SPY | $370B+ | 80,000,000+ | 1-2 |
| QQQ | $200B+ | 40,000,000+ | 1-3 |
| REMX | $200M | 150,000 | 10-15 |
Investors in thinly traded ETFs risk facing wider spreads and potentially increased price slippage. This becomes particularly troublesome during market turbulence when liquidity can quickly evaporate.
Additionally, very small AUM may lead to closure risk. ETFs that fail to attract investor interest might be liquidated by issuers, compelling investors to sell at unfavorable prices or during inconvenient times.
Examining the ETF’s Holdings and Sector Allocation
A deep dive into an ETF’s holdings reveals where capital is allocated and how diversified the fund truly is. Some ETFs may claim to represent a sector or theme but often concentrate holdings in a few large companies.
For example, the Technology Select Sector SPDR Fund (XLK), tracking the technology sector, has significant exposure to a handful of giant firms like Apple and Microsoft which together comprise over 40% of its holdings. This concentration can amplify both risks and rewards.
By contrast, the Vanguard Total World Stock ETF (VT) holds thousands of stocks across various sectors and regions, offering broad diversification that often results in lower volatility.
Sector concentration can be evaluated with a table:
| ETF Symbol | Top 3 Holdings (Weight %) | Sector Concentration (%) |
|---|---|---|
| XLK | Apple (20%), Microsoft (19%), NVIDIA (5%) | Technology (100%) |
| VTI | Apple (6%), Microsoft (5%), Alphabet (2%) | Technology (27%), Financials (14%) |
| BOTZ | Intuitive Surgical (8%), Nvidia (6%), ABB (5%) | Robotics/AI (100%) |
Understanding how sector exposure aligns with macroeconomic trends is vital. For instance, if investors anticipate inflationary pressures, they might favor ETFs with higher allocations to materials or energy sectors, known traditional inflation hedges.
Additionally, geographical diversification matters. ETFs focusing solely on the U.S. market may miss growth or face risks specific to that economy, while global or emerging market funds present both growth opportunities and increased volatility.
Incorporating Tax Efficiency and Distribution Policies
Tax implications significantly affect ETF returns, especially for taxable accounts. Many ETFs are structured with tax efficiency in mind, using mechanisms such as in-kind redemptions to minimize capital gains distributions.
Equity ETFs that track indexes typically have low turnover, which translates to fewer taxable events. For instance, the Vanguard S&P 500 ETF (VOO) exhibited an annual turnover ratio around 5%, minimizing realized capital gains.
Conversely, actively managed or thematic ETFs may experience higher turnover, triggering more frequent capital gains distributions. The ARK Innovation ETF (ARKK), known for its active management style, has seen turnover rates exceeding 80%, leading to higher tax liabilities for investors.
Further, dividend yield and distribution frequency are critical. ETFs that distribute dividends regularly, such as bond ETFs or dividend-focused equity ETFs, provide income but may also increase tax obligations annually. It’s important to review an ETF’s distribution schedule and how dividends are taxed under your jurisdiction.
Investors in tax-advantaged accounts (IRAs, 401(k)s) can mitigate tax concerns, but those in taxable brokerage accounts should carefully consider ETF structure, turnover, and distribution history.
Looking Ahead: Trends Shaping the Future of ETF Investments
The ETF market continues to evolve rapidly, influenced by technological advancements, investor preferences, and regulatory changes. Understanding these trends can help investors anticipate shifts in liquidity, cost structures, and investment opportunities.
One prominent development is the rise of thematic and actively managed ETFs, tapping into megatrends like clean energy, artificial intelligence, and ESG (Environmental, Social, and Governance) investing. These funds offer unique growth opportunities but often at higher fees and increased volatility.
Data from Morningstar shows that thematic ETFs gathered $20 billion in net inflows in 2023 alone, signaling sustained investor appetite. However, due diligence remains critical, as many thematic ETFs are relatively new and may experience performance and liquidity challenges.
Another trend is increasing competition pushing down fees. Bloomberg Intelligence reported that average ETF expense ratios declined by roughly 15% between 2020 and 2023. The introduction of zero-fee ETFs by major providers exemplifies this price war, benefiting investors but raising questions about long-term sustainability.
Regulatory scrutiny also is intensifying, with proposals to improve transparency around ETF holdings, liquidity risk management, and investor protection. This means future ETFs will likely offer better compliance and clarity, enhancing investor confidence.
Lastly, technological integration, including AI-driven analytics and robo-advisors, is simplifying ETF selection and portfolio rebalancing processes, making it easier for everyday investors to benefit from diversified, low-cost investments.

Analyzing an ETF before investing requires a multifaceted approach that goes well beyond simply looking at recent returns or catchy fund names. By critically evaluating the ETF’s investment objective, historical performance, costs, liquidity, holdings, and tax considerations, investors can make informed choices that align with their financial goals and risk tolerance. Understanding future trends in the ETF space further empowers investors to stay ahead of market changes and leverage new opportunities effectively. With careful analysis and ongoing education, ETFs can serve as a powerful tool to build diversified, cost-efficient, and resilient investment portfolios.

