Building a Personal Dashboard with Airtable
In today’s fast-paced digital world, managing personal information and tasks efficiently is crucial for productivity and achieving goals. A personal dashboard serves as a centralized hub where users can monitor, plan, and execute various aspects of their lives, from daily tasks and habits to finances and project management. Among the many tools available, Airtable stands out as a flexible platform that blends the simplicity of spreadsheets with the power of databases. This article explores how to build a personal dashboard using Airtable, detailing practical steps, examples, and benefits while comparing it with other tools.
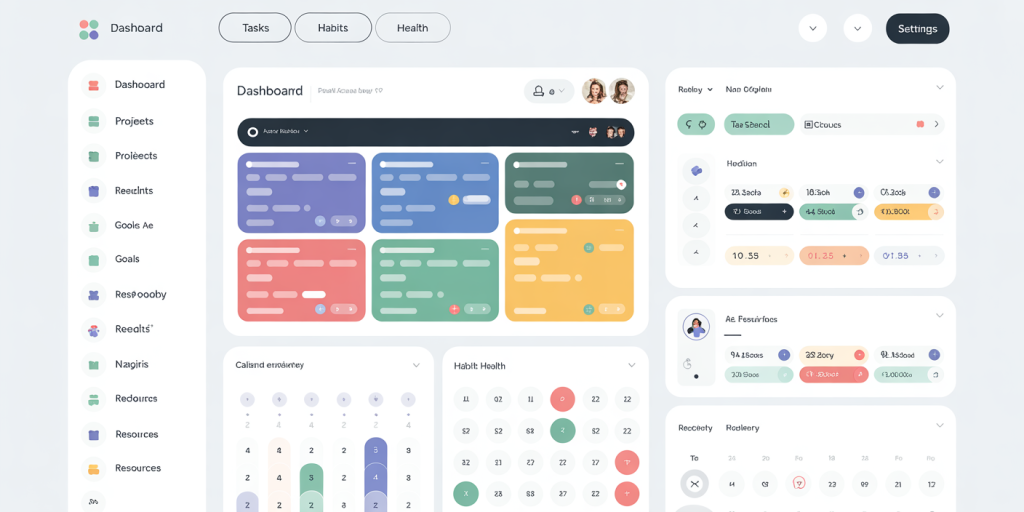
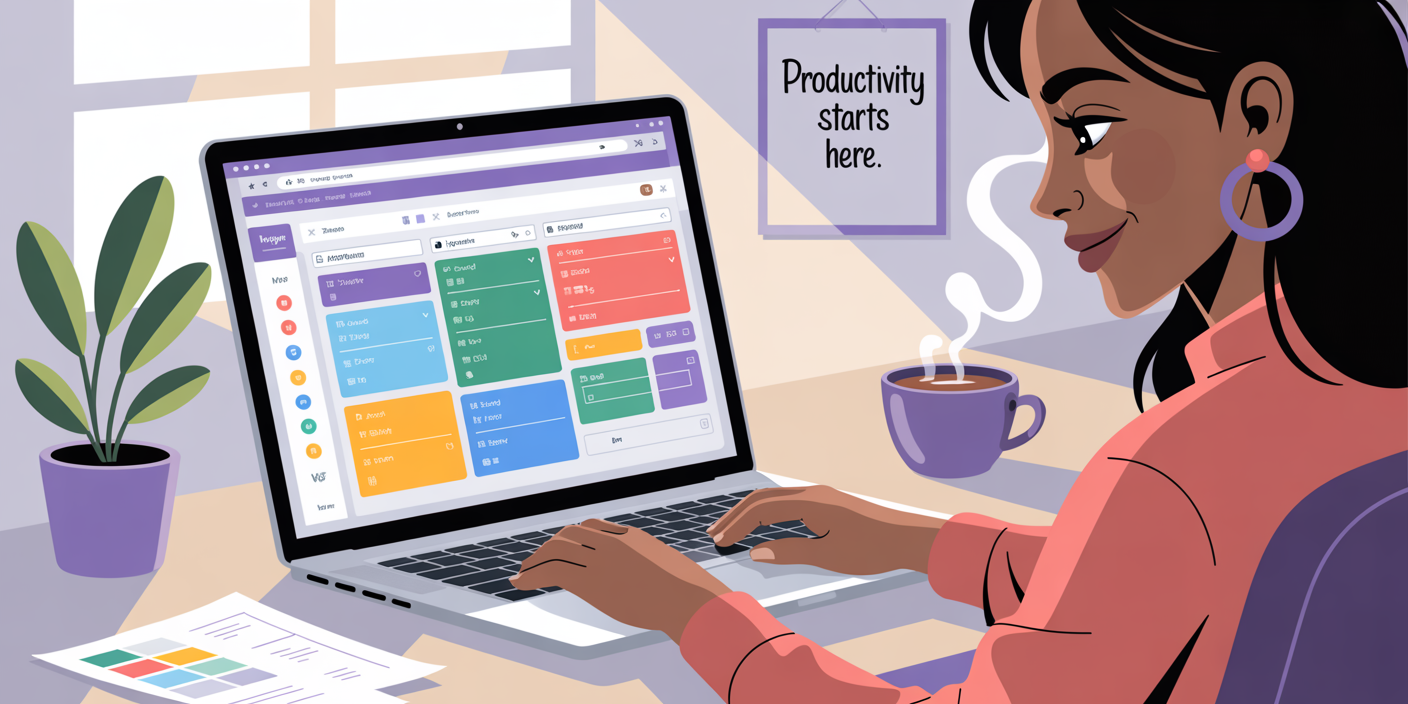
Illustration of a freelancer managing client projects, invoices, and daily habits seamlessly using Airtable’s relational database and automation features on a laptop
Understanding the Power of Airtable for Personal Dashboards
Airtable is often described as a spreadsheet-database hybrid because it combines the user-friendly interface of spreadsheets with robust relational database capabilities. This dual characteristic makes it uniquely suited for users who want more than just a to-do list or calendar but find traditional database software too complex. According to Airtable’s 2023 user data, over 200,000 organizations worldwide use it to streamline workflows, reflecting its versatility.

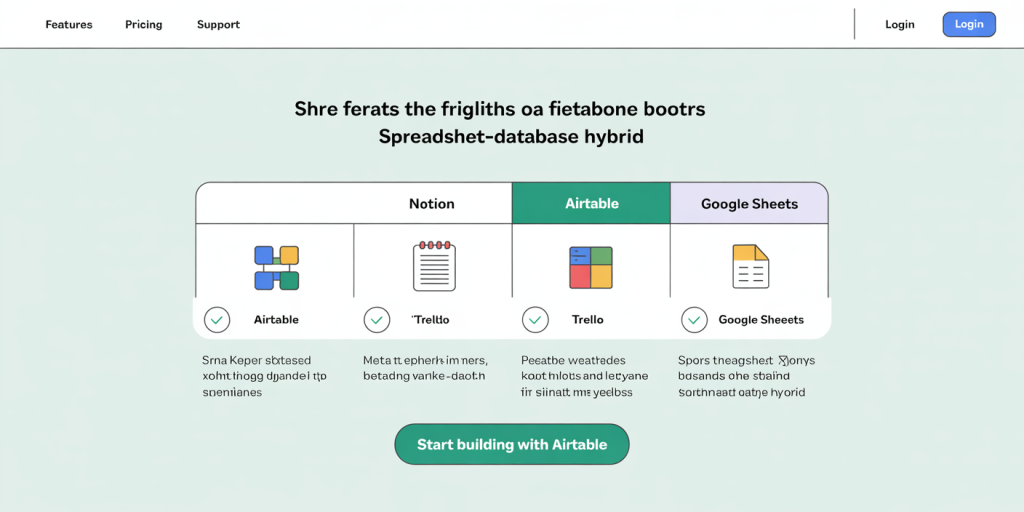
Comparison table graphic highlighting Airtable vs Notion, Trello, and Google Sheets with icons and feature checkmarks emphasizing Airtable’s unique spreadsheet-database hybrid and automation capabilities
Using Airtable for personal dashboards taps into this power by allowing you to customize views, link data across tables, and integrate automations that keep you organized. This flexibility is especially useful for personal use cases like habit tracking, financial budgeting, goal setting, or project management without requiring extensive technical skills.
For example, a freelancer managing multiple clients can use Airtable to track project deadlines, payments, and client communications within a single dashboard. This reduces clutter from multiple apps and enhances focus, which Nielsen Norman Group identifies as key to productivity improvements.
Step-by-Step Guide to Creating a Personal Dashboard in Airtable
Building an effective personal dashboard in Airtable begins with proper planning. Identify which aspects of your life or work you want to monitor. Common sections include tasks, goals, health and habits, learning progress, finances, and personal projects.
A modern personal dashboard interface in Airtable showing linked tables for tasks, habits, and health metrics with colorful Kanban and Calendar views on screen
Start by creating a new base (Airtable’s term for databases). For instance, if your focus is productivity and health, create tables labeled “Tasks,” “Habits,” and “Health Metrics.” Populate each table with relevant fields. In “Tasks,” you might include task name, deadline, priority level, and status. For “Habits,” include habit name, frequency, and completion status.
A key practical example is using Airtable’s “Kanban” view for task management. Visualizing tasks by priority or status enables quick understanding of priorities. Similarly, the “Calendar” view supports scheduling by deadline dates, making tracking effortless.
Once data is entered, customize views and link tables for seamless navigation. Linking “Tasks” to “Projects” is helpful for managing related work. Airtable’s drag-and-drop interface simplifies reorganizing data fields, which is ideal for iterative dashboard development.
Incorporate automations such as email reminders or status updates. For example, if a deadline approaches and task status is not marked complete, Airtable can send a notification. This automation saves time and ensures deadlines aren’t missed, contributing to a sense of reliability and control.
Practical Examples of Personal Dashboards in Airtable
Several real-world cases demonstrate the successful implementation of personal dashboards with Airtable. One notable example is graphic designer Jane, who uses a personal dashboard to manage client projects, track income, and maintain daily habits. Her “Client Projects” table links to “Invoices,” and “Tasks” helps her prioritize design requests. This structure reduced her project turnaround time by 20%, as she shared in a 2023 interview.
Another practical example is Mark, a software developer and novice stock investor. He built a personalized dashboard combining his coding projects, learning goals (like mastering new programming languages), and investment portfolio performance, all in one Airtable base. Mark’s dashboard integrates web clips and stock price trackers through Airtable’s API, enabling real-time data updates without manual data entry.
Such examples highlight the diverse adaptability of Airtable. Users can tailor their dashboards to personal or professional needs, combining task lists, data databases, and visualizations without needing complicated coding.
Comparing Airtable to Other Personal Dashboard Tools
When choosing a tool for building personal dashboards, it’s essential to understand their features and limitations to pick the best fit. The table below compares Airtable with popular alternatives like Notion, Trello, and Google Sheets.
| Feature | Airtable | Notion | Trello | Google Sheets |
|---|---|---|---|---|
| User Interface | Spreadsheet + Database hybrid | All-in-one workspace | Kanban board-focused | Spreadsheet-based |
| Customization | High, with relational tables | Moderate, flexible pages | Low to moderate | High via formulas and scripts |
| Automation | Native integrations and scripts | Limited built-in automation | Power-ups and integrations | Via Google Apps Scripts |
| Collaboration | Real-time with permission roles | Real-time, rich content editing | Real-time, comment support | Real-time with sharing options |
| Learning Curve | Moderate | Moderate | Low | Low to moderate |
| Mobile App | Yes | Yes | Yes | Yes |
| Cost (Free tier) | Up to 1,200 records per base | Unlimited pages, limited blocks | Unlimited cards | Unlimited sheets and cells |
As observed, Airtable excels in structured data management and automation, valuable for users who want more than simple list-keeping. Conversely, Notion focuses on note-taking and document creation, which suits users prioritizing written content organization over data relations.
For users needing task organization in a visual sense, Trello’s Kanban approach is straightforward but lacks deep customization for data relations. Google Sheets remains a robust spreadsheet tool with high customization through scripting but lacks database strengths.
In summary, Airtable strikes a balance between usability and power, making it highly suitable for personal dashboards that integrate multiple aspects of life and work.
Tips for Maximizing Your Airtable Personal Dashboard
To fully harness Airtable’s potential, it’s beneficial to employ techniques that improve efficiency and clarity. First, leverage linked records. For example, if tracking books you want to read and the related reading goals, linking these tables provides a comprehensive overview. Linked records reduce data duplication and enable complex relationship modeling.
Second, use multiple views tailored to different purposes. For instance, a “Weekly Focus” view filtered to show only current week’s high-priority tasks promotes focus and mental clarity. Create separate views for long-term goals or daily habits, allowing you to toggle quickly between different life dimensions.
Third, integrate external data sources using Airtable’s API and popular integration platforms like Zapier or Integromat. For example, automatically importing calendar events or email tasks into your dashboard streamlines information flow and reduces manual input.
Lastly, regularly review and update your dashboard structure. A survey by the Productivity Institute in 2022 found that personal dashboards updated weekly led to a 15% increase in goal attainment due to the consistent reflection and adjustment of plans.
Monitoring and Analyzing Progress with Airtable Dashboards
Personal dashboards are most effective when paired with data analysis and reflection. Airtable offers grouping, filtering, and summary features that simplify tracking progress and patterns.
For example, a habit tracker table can group habits by frequency or category, with summary bars counting completion rates. This data helps identify trends like which habits are stable and which require extra focus. Monitoring this over months provides actionable insights for behavioral adjustment.
Task trackers benefit from visual cues like color coding statuses (e.g., overdue, in-progress, completed) to quickly grasp workload dynamics. Visual dashboards combining calendar views and task status can highlight bottlenecks or opportunities for rescheduling.
Integrating charts and graphs through Airtable’s interfaces or external tools like Tableau or Google Data Studio offers advanced visualization of personal metrics, such as monthly spending against budget or time spent on activities.
These analytical capabilities are key in transforming dashboards from static information repositories into dynamic tools for personal growth and efficiency enhancement.
Future Perspectives: The Evolution of Personal Dashboards with Airtable
The future of personal dashboards lies in increasingly seamless integration, automation, and AI-driven insights. Airtable continuously expands its ecosystem with more powerful integrations and automation tools, such as AI-powered recommendation engines for improving task prioritization and goal setting.
Emerging trends include voice-activated data entry and dashboard querying, enabling hands-free management. AI assistants integrated within dashboards may soon offer predictive analytics, suggesting behavior changes or flagging potential risks like budget overspending.
Beyond individual use, personal dashboards are evolving into collaborative platforms where families, small teams, or coaches can track shared objectives with personalized views, enhancing accountability and support networks.
Recent Airtable roadmap announcements indicate a focus on improved mobile experiences and enhanced data visualization options, key for on-the-go management and deeper analytical insights.
As personal data management tools blend AI capabilities with intuitive design, users will enjoy increasingly smart and adaptive dashboards that not only reflect current status but actively guide decisions for improved well-being and productivity.