
How to Evaluate a Company’s Financial Health Before Buying Its Stock
Investing in stocks requires more than just analyzing market trends or relying on tips; it demands a comprehensive understanding of a company’s financial health. Before buying a stock, evaluating the company’s financial condition provides crucial insights into its ability to generate profits, manage debt, and sustain growth. This approach minimizes risk and maximizes potential returns. Assessing financial health equips investors with the knowledge to make well-informed decisions, ensuring a better grasp of the company’s strengths and vulnerabilities.
Assessing a company’s financial health involves the analysis of numerous financial statements, ratios, and market indicators. This article will explore practical techniques and real-world examples that highlight how investors can scrutinize a company’s financial stability, profitability, and growth prospects. From financial ratios to cash flow analysis, understanding these metrics helps individual and institutional investors effectively gauge investment opportunities.
Understanding Financial Statements: The Foundation of Analysis
Financial statements serve as the backbone for evaluating a company’s financial position. The three primary statements—Income Statement, Balance Sheet, and Cash Flow Statement—offer complementary views of company operations.
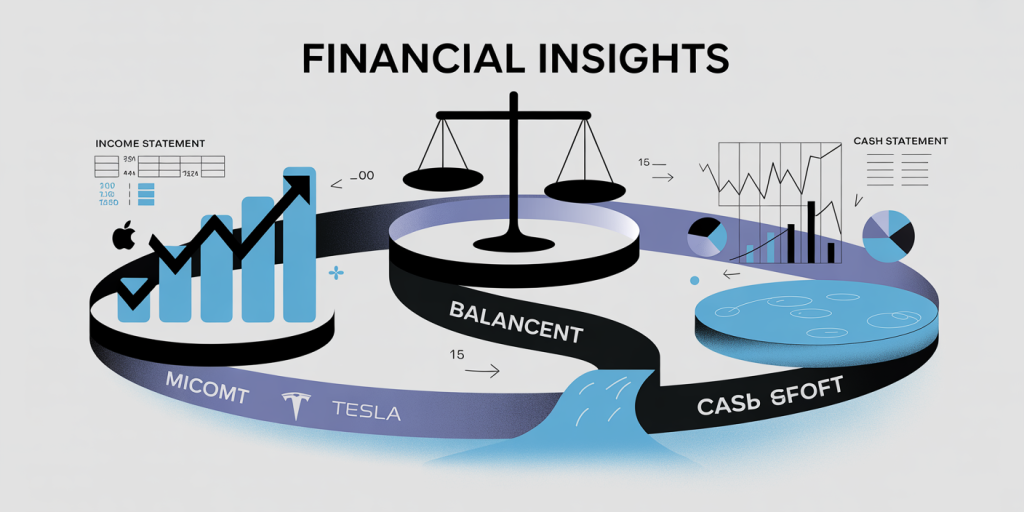
The income statement presents revenues, expenses, and profits over a reporting period, helping investors assess how effectively a company manages costs while growing sales. For example, comparing Apple Inc.’s (AAPL) income statements over the past five years demonstrates consistent revenue growth from $229 billion in 2017 to $394 billion in 2022, with net income margins stabilizing above 20%. Such trends indicate long-term profitability and operational efficiency.
The balance sheet outlines assets, liabilities, and shareholders’ equity, providing insight into the company’s solvency and capital structure. Investors examining Tesla (TSLA) observe a substantial increase in total assets, from $28 billion in 2017 to $82 billion in 2022, coupled with controlled liabilities, signaling strengthening financial strength and liquidity.
Lastly, the cash flow statement reveals how a company generates and uses cash. Positive operating cash flow, as seen with Microsoft (MSFT) generating $76 billion in 2022, reflects strong core business operations. Meanwhile, how much the company invests in capital expenditures or returns to shareholders through dividends and buybacks sheds light on management’s growth strategies and shareholder value orientation.
Key Financial Ratios to Measure Profitability and Efficiency
Financial ratios distill complex data into quantifiable metrics that investors can compare across different companies or industries. Profitability ratios like Return on Equity (ROE), Gross Profit Margin, and Net Profit Margin indicate how effectively management utilizes resources to generate profits.

For instance, ROE measures net income as a percentage of shareholder equity. A high ROE, such as NVIDIA’s 47.1% in 2023, signifies efficient use of capital. However, investors must analyze whether this is driven by sustainable earnings or excessive leverage.
Efficiency ratios such as Asset Turnover and Inventory Turnover reveal how well a company uses assets and manages inventory. Amazon’s (AMZN) asset turnover ratio of approximately 1.1 in 2023 signifies it generates $1.10 in sales for every dollar of assets, outperforming many peers, reflecting operational efficiency in its sprawling logistics network.
Including a comparative table helps illustrate these concepts clearly:
| Company | ROE (%) | Gross Profit Margin (%) | Asset Turnover | Inventory Turnover (times) |
|---|---|---|---|---|
| Apple | 41.3 | 43.3 | 0.74 | 40.0 |
| Tesla | 25.2 | 20.3 | 0.67 | 5.1 |
| Amazon | 10.1 | 24.0 | 1.10 | 8.8 |
| Microsoft | 43.5 | 68.4 | 0.56 | N/A |
This table helps investors compare how companies differ in profitability and operational efficiency, underpinning decisions on stock purchases.
Analyzing Liquidity and Solvency for Risk Assessment
Financial health also depends on a company’s ability to meet short-term and long-term obligations. Liquidity ratios, such as the Current Ratio and Quick Ratio, evaluate whether a company can cover its immediate liabilities with available assets.
For example, General Electric (GE) had a current ratio near 1.2 in 2023, indicating it holds $1.20 in current assets for every dollar of current liabilities. This suggests adequate liquidity but requires attention compared to its historical average of 1.5, reflecting a potential tightening in working capital.
Solvency ratios, including Debt-to-Equity (D/E) and Interest Coverage Ratio, indicate long-term financial stability and the company’s ability to manage debt. A company like Ford Motor (F) with a D/E ratio around 3.0 indicates high leverage, which could increase risk during economic downturns, while its interest coverage ratio of 5.2 (earnings before interest and taxes divided by interest expense) suggests it comfortably services its debt.

Liquidity and solvency ratios are vital red flags or green lights for investors, especially in volatile markets. Deep analysis allows discerning if a company is overextended financially or maintains a healthy capital balance capable of weathering economic shocks.
Assessing Cash Flow: The Lifeblood of Business Sustainability
While profitability is important, cash flow analysis offers a real-time pulse of financial health. Earnings reported can be influenced by accounting policies and non-cash items, but cash flow reveals actual liquidity.
Operating cash flow (OCF) shows cash generated from business activities. Negative OCF over consecutive quarters warns investors of operational inefficiencies or declining business, as was evident with Snapchat parent Snap Inc. (SNAP) before its turnaround in 2023. Positive OCF, similarly, as seen with Alphabet (GOOGL) consistently generating over $80 billion annually, confirms sustainable profitability.
Free cash flow (FCF) subtracts capital expenditures from OCF, indicating money available for dividends, debt repayment, or reinvestment. FCF of $30 billion in 2022 helped Johnson & Johnson undertake acquisitions and boost dividends, making its stock attractive to income-focused investors.
Monitoring cash flow trends over time uncovers whether a company is investing wisely, managing costs, and generating returns, helping buyers avoid surprises like Kodak’s cash crunch during its decline.
Evaluating Market Position and External Factors
Financial metrics only tell part of the story. Evaluating qualitative elements, such as market position, competitive advantages (moat), and industry trends, integrates context into financial decisions.
Companies like Amazon leverage dominant market positions and vast logistics networks to sustain profitability, evidenced in its robust financial ratios. Similarly, brand power and patent portfolios, as seen with pharmaceutical giant Pfizer, provide defensive barriers supporting steady income streams.
Industry dynamics, regulatory environments, and macroeconomic factors also impact financial health. The energy sector’s recent challenges due to geopolitical tensions raised operating costs, pressuring companies with high debt levels such as Occidental Petroleum (OXY).
Investors should combine financial evaluations with analysis of the broader environment to better forecast the sustainability of profits and growth. A tech firm operating at a loss during early growth stages may still be viable with strong future prospects, unlike a highly indebted retailer facing structural headwinds.
Emerging Trends and Future Perspectives in Financial Evaluation
Looking ahead, evaluating financial health will incorporate more advanced technologies and methodologies. Artificial intelligence and machine learning increasingly analyze vast datasets, enabling more precise risk assessment and scenario planning.
Environmental, Social, and Governance (ESG) factors are becoming integral in financial health evaluation. Companies with strong ESG ratings tend to exhibit better long-term stability. For instance, companies like Tesla and Microsoft rank highly on ESG indices, appealing to investors factoring sustainability into their decisions.
Additionally, real-time data analytics will provide up-to-the-minute insights on financial performance, reducing reliance on quarterly reports alone. This shift permits more dynamic portfolio adjustments in volatile markets.
Incorporating alternative data, such as customer sentiment and supply chain analytics, alongside traditional financial metrics promises a richer evaluation framework, making the investing process more holistic and forward-looking.
Thorough financial evaluation is essential for investors aiming to identify stocks with solid foundations and promising futures. By analyzing financial statements, key ratios, cash flow, liquidity, and solvency, alongside market context and emerging trends, individuals can better navigate complexities and optimize investment outcomes with confidence.