
The Basics of Technical Analysis for Beginner Investors
Understanding the financial markets can be daunting for new investors. One of the fundamental tools used to navigate stock price movements and market trends is technical analysis. Unlike fundamental analysis, which assesses a company’s intrinsic value through economic indicators and financial statements, technical analysis focuses on historical price data and trading volumes to predict future price trends. This article breaks down the basics of technical analysis, making it accessible and actionable for beginner investors keen on improving their decision-making skills.
What is Technical Analysis and Why Does It Matter?
Technical analysis involves studying charts and statistical indicators derived from past market activity to forecast future price movements. The premise is that market prices reflect all known information and that price movements follow identifiable trends, which tend to repeat due to investor psychology.
For example, if a stock like Apple Inc. (AAPL) shows a consistent upward movement in its stock price over weeks or months, technical analysts infer that the positive momentum will likely continue, barring unforeseen events. In contrast, sudden volume spikes accompanied by price drops may signal an imminent reversal. Using technical indicators helps investors capitalize on such insights to time their entry and exit points better, optimizing returns or minimizing risks.
Technical analysis is widely used across various markets, including equities, forex, and commodities. According to a 2023 survey by the Chartered Market Technicians Association (CMTA), nearly 70% of retail traders utilize technical analysis tools to a significant degree in their trading plans. This widespread adoption underlines its value as a core skill set for navigating competitive financial markets.
Key Components of Technical Analysis
Technical analysis relies on two principal components: price charts and technical indicators. These elements synergize to provide insights into potential market behavior.
Price Charts
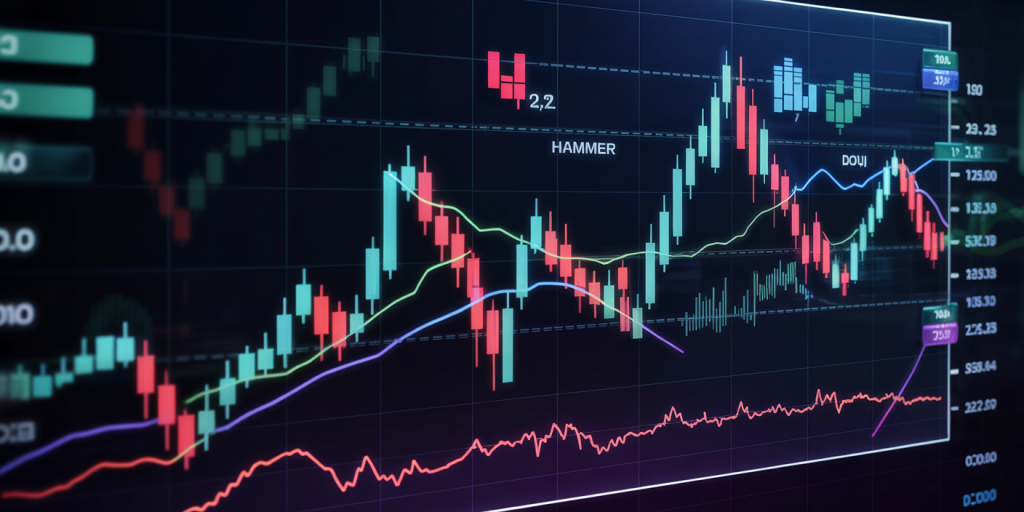
Price charts are visual representations of a security’s historical price action, typically illustrating the open, high, low, and close prices for specific periods, such as daily, weekly, or monthly intervals. There are several types of charts: Line Charts: Connect closing prices over time, providing a simplified view. Bar Charts: Show the full range of price movement within each period. Candlestick Charts: Similar to bar charts but use “candles” with bodies and wicks to represent price ranges, popularized by Japanese traders in the 18th century.
Candlestick charts are particularly favored for their visual clarity and ability to indicate market sentiment through patterns like “doji,” “hammer,” or “engulfing” formations. For instance, a hammer pattern after a downtrend might suggest a bullish reversal, signaling that prices may rise soon.
Technical Indicators
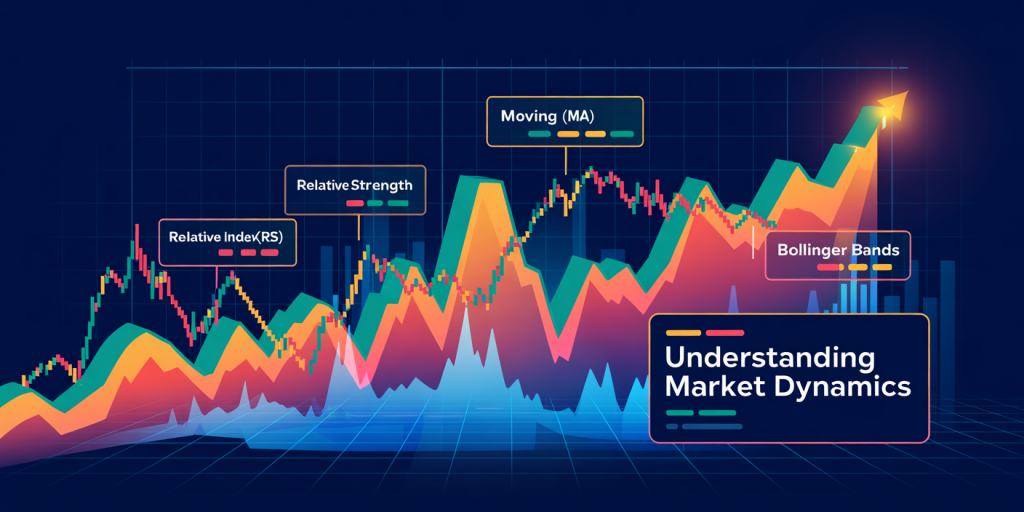
Indicators are mathematical calculations applied to price and volume data to identify trends, momentum, volatility, and market strength. Common types include: Trend Indicators: Moving Averages (MA), Moving Average Convergence Divergence (MACD) Momentum Indicators: Relative Strength Index (RSI), Stochastic Oscillator Volatility Indicators: Bollinger Bands, Average True Range (ATR) Volume Indicators: On-Balance Volume (OBV), Chaikin Money Flow (CMF)
For example, a simple 50-day Moving Average smooths out short-term fluctuations, helping investors spot the general direction of a trend. A stock trading above its 50-day MA might be considered in a bullish phase, whereas crossing below could indicate a bearish shift.
Practical Examples of Technical Analysis
To bring technical analysis into a more practical focus, consider Elon Musk’s high-profile involvement with Tesla Inc. (TSLA). Tesla’s stock price is notoriously volatile, often reacting strongly to news and social media sentiments. By analyzing Tesla’s stock charts, beginner investors could identify key support levels around $600 and resistance near $750 during mid-2023.
For example, after Tesla stock retraced to the $600 support multiple times without breaking down, it presented a low-risk buying opportunity according to technical analysis principles. Conversely, persistent failure to break above $750 resistance suggested profit-taking zones for short-term traders.
Another real case involved Amazon (AMZN) prior to its Q4 earnings in 2023. The Relative Strength Index (RSI) had plunged below 30—a level generally considered oversold—indicating a potential rebound. Technical analysts predicted a bounce-back before earnings, which materialized shortly thereafter, rewarding those who leveraged this insight.
Comparative Table: Popular Technical Indicators for Beginners
| Indicator | Purpose | Typical Use Case | Strengths | Limitations |
|---|---|---|---|---|
| Simple Moving Average (SMA) | Trend identification | Smoothes price data to identify trend direction | Easy to calculate and interpret | Lagging indicator, slow to react |
| Relative Strength Index (RSI) | Momentum measurement | Detects overbought or oversold conditions | Helps time entry/exit decisions | False signals in strong trends |
| Bollinger Bands | Volatility measurement | Highlights price volatility and potential breakouts | Adapts to volatility levels | Can signal indecisive markets |
| MACD | Trend and momentum | Captures changes in trend strength and duration | Combines trend and momentum signals | Can lag during sideways markets |
| Stochastic Oscillator | Momentum measurement | Compares closing price to a range over time | Useful for identifying reversals | May produce false signals in volatile markets |
This comparative overview illustrates how combining multiple indicators can provide a more accurate market picture rather than relying on any single tool alone.
Common Misconceptions and Pitfalls
Despite its popularity, technical analysis is often misunderstood or misapplied by beginner investors. One common misconception is that technical analysis guarantees profits. While it can improve the probability of making profitable trades, it does not eliminate risk. Markets can be unpredictable due to external factors like economic news, geopolitical events, or sudden shifts in investor sentiment.
Another pitfall is over-complication—new investors sometimes use too many indicators, leading to “analysis paralysis,” where conflicting signals make decision-making harder. It is more effective to master a few well-understood tools and tailor them to individual trading strategies.
For instance, novice traders might use only the 20-day Moving Average and RSI to identify entry points, instead of juggling a dozen indicators that send mixed messages. Keeping it simple allows for clearer judgment and better risk management.
How to Start Applying Technical Analysis Safely
Beginner investors should approach technical analysis as a skill developed over time through practice and study. Several steps can facilitate a safer and more effective start: Education: Utilize resources like online courses, books, and webinars—”Technical Analysis of the Financial Markets” by John J. Murphy is a classic recommended text. Paper Trading: Practice strategies without risking real money using virtual trading platforms. Chart Analysis: Regularly review charts of stocks or indices of interest. Start with liquid, well-followed stocks like Microsoft (MSFT) or SPDR S&P 500 ETF (SPY) which have high volumes and clearer trends. Risk Management: Use tools like stop-loss orders to limit potential downside. Combine with Fundamentals: Use technical signals in conjunction with fundamental analysis for more informed decisions.

By systematically learning and applying technical analysis, investors increase their abilities to make timely trading decisions and reduce emotional biases.
Future Perspectives in Technical Analysis for Investors
The field of technical analysis continues to evolve alongside technological advances and increased access to real-time market data. Artificial intelligence (AI) and machine learning algorithms now assist in analyzing vast datasets, detecting complex patterns, and generating predictive models. This technological augmentation empowers investors, including beginners, with advanced analytical capabilities once reserved for institutional traders.
Moreover, the rise of algorithmic trading means the markets increasingly react to technical signals, sometimes leading to self-fulfilling prophecies that reinforce trend movements. However, this also introduces new challenges, such as market flash crashes or sudden volatility spikes, emphasizing the need for sound risk management alongside technical analysis.
In the coming years, expect more integration of technical analysis within robo-advisors and digital broker platforms, where AI-driven charting tools help investors visualize trends and receive automated suggestions tailored to their risk profiles.
Ultimately, the essence of technical analysis remains anchored in understanding human psychology and market behavior. For beginner investors, mastering its basics lays a strong foundation not only to interpret price action but also to navigate the ever-changing landscape of financial markets more confidently.